Charts 2D
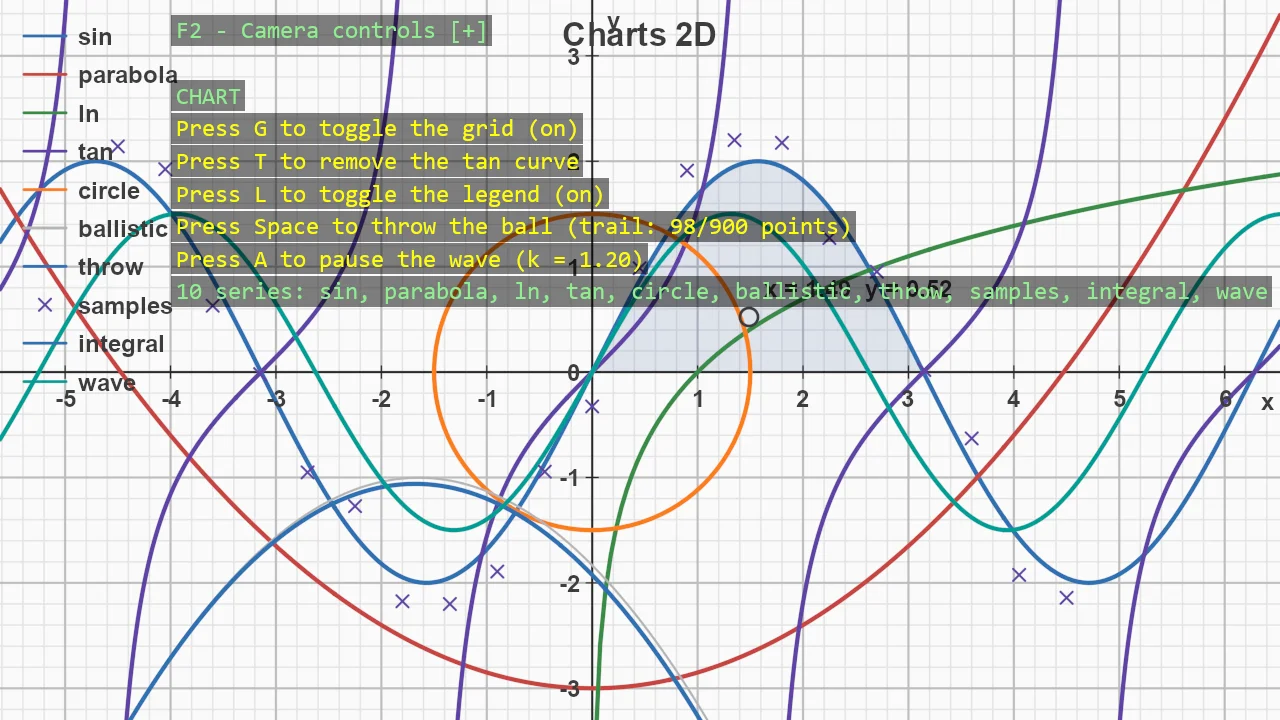
A flat, paper-like chart drawn entirely in code - no assets, no chart control, every line a pixel-width stroke in a shape batch. Function plots handle their own awkward cases: ln(x) starts where its domain does, tan(x) is cut into branches at its asymptotes instead of being joined by a false vertical line, and everything is clipped to the chart's ranges. On top of that sit a parametric loop, scatter markers, a shaded region under a curve, a trajectory that records a thrown ball while it flies, and a curve whose function is swapped every frame. Pan and zoom and the chart re-targets its ranges to whatever the camera sees, rebuilding axes, ticks, labels and curves for the new view - the Desmos trick.
The Program.cs file shows how to:
- Plotting y = f(x) with clipping, NaN handling and asymptote splitting
- Parametric curves closed back on themselves
- Scatter markers drawn as pixel-sized glyphs
- Shading the region under a curve
- Recording a moving body with a growing trajectory
- Animating a curve by swapping its function in place
- A view-driven chart that follows an orthographic camera
- Grouped ChartOptions and per-series colour
Note
This example references Stride.CommunityToolkit.Charts, which is not on NuGet yet. Run it from a clone of the
repository, where the package is a project reference; a copy of the project on its own will not build.
View on GitHub.
using Stride.CommunityToolkit.Charts;
using Stride.CommunityToolkit.Engine;
using Stride.CommunityToolkit.Rendering.Compositing;
using Stride.CommunityToolkit.Scripts;
using Stride.CommunityToolkit.Scripts.Utilities;
using Stride.CommunityToolkit.Shapes;
using Stride.CommunityToolkit.Windows;
using Stride.Core.Mathematics;
using Stride.Engine;
using Stride.Games;
using Stride.Graphics;
using Stride.Input;
using System.Globalization;

// A flat, paper-like chart under an orthographic camera - every feature the chart library has in 2D:
// function plots with their asymptotes clipped, a parametric loop, scatter markers, a shaded region, a
// trajectory recorded from a moving body, an animated curve, a legend, titles and a mouse readout.
//
// The one thing here that a 3D chart cannot do is FollowCamera: the chart re-targets its ranges to
// whatever the camera sees, so panning and zooming rebuild the axes, ticks, labels and curves for the
// new view. That is an orthographic idea, and it is what makes this feel like Desmos rather than a
// figure printed on a page.
//
// Controls: drag to pan, wheel to zoom, G grid, L legend, T removes or restores tan, Space throws the
// ball, A pauses the animated curve. The keys share a screen block with the camera help - F2 collapses
// it, F3 moves it, F4 hides it.

// Without this a scaled-up 4K desktop hands the game a scaled, blurred window. A no-op off Windows.
WindowsDpiManager.EnablePerMonitorV2();

// "--zoom 61" starts zoomed out to that view height - handy for seeing how the view-driven chart adapts
// its tick step, sampling density and line widths
var zoomArg = 0f;
var zoomIndex = Array.FindIndex(args, a => a.Equals("--zoom", StringComparison.OrdinalIgnoreCase));
if (zoomIndex >= 0 && zoomIndex + 1 < args.Length) _ = float.TryParse(args[zoomIndex + 1], NumberStyles.Float, CultureInfo.InvariantCulture, out zoomArg);

using var game = new Game();

Chart? chart = null;
ChartCurve? tangent = null;
ChartCurve? wave = null;
ChartTrajectory? trail = null;
CameraComponent? camera = null;
ShapeBatch? batch = null;

// The thrown ball: launched from the lower left, integrated by hand each frame - the point is watching
// the trajectory series record a moving body, not the integrator
var launchPosition = new Vector2(-4.5f, -3.5f);
var launchVelocity = new Vector2(4f, 7f);
const float Gravity = 9.81f;
var ballPosition = Vector2.Zero;
var ballVelocity = Vector2.Zero;
var ballFlying = false;

// The animated curve: sin(kx) with k sweeping up and down, re-plotted in place every frame
var animate = true;
var waveTime = 0f;
var waveFrequency = 1f;
const float WaveAmplitude = 1.5f;

game.Run(start: Start, update: Update);

void Start(Scene rootScene)
{
    game.Window.AllowUserResizing = true;
    game.Window.Title = "Charts 2D";

    // What SetupBase2DScene does, minus the physics ground a chart does not need, plus MSAA (thin lines
    // flicker without it) and a paper-like background
    game.Add2DGraphicsCompositor(clearColor: new Color(250, 250, 250), msaa: MultisampleCount.X4).AddUIStage();
    game.Add2DCamera();

    var cameraEntity = game.Add2DCameraController();
    var controller = cameraEntity.Get<Basic2DCameraController>()!;

    // Left-drag pans like a canvas app, and the view-driven chart invites zooming far out
    controller.MouseDragButton = MouseButton.Left;
    controller.MaxOrthographicSize = 500f;

    if (zoomArg > 0f && cameraEntity.Get<CameraComponent>() is { } zoomCamera)
    {
        zoomCamera.OrthographicSize = zoomArg;
    }

    // Light2D is the flat preset: dark axes, a major and minor grid, no glow, and labels that keep their
    // pixel size while zooming. Everything below is a change to one group of it.
    var options = ChartOptions.Light2D();

    options.Range.XMin = -5f;
    options.Range.XMax = 5f;
    options.Range.YMin = -4f;
    options.Range.YMax = 4f;

    options.Title.Text = "Charts 2D";
    options.Axes.XTitle = "x";
    options.Axes.YTitle = "y";

    chart = new Chart(game, options);
    chart.Root.Scene = rootScene;

    // Curves added without a colour take the next one from the palette
    chart.Plot(x => 2f * MathF.Sin(x), name: "sin");
    chart.Plot(x => 0.15f * x * x - 3f, name: "parabola");

    // The awkward ones: ln(x) is NaN left of zero, so the curve simply starts at the y axis; tan(x)
    // shoots past the top and bottom and jumps across each asymptote, and is clipped to the edges and
    // cut into branches rather than joined by a false vertical line
    chart.Plot(MathF.Log, name: "ln");
    tangent = chart.Plot(MathF.Tan, name: "tan", samples: 600);

    // A parametric curve closed back on itself
    chart.PlotParametric(
        t => new Vector3(1.5f * MathF.Cos(t), 1.5f * MathF.Sin(t), 0f), 0f, MathUtil.TwoPi,
        color: options.Series.Palette[4],
        name: "circle",
        samples: 96,
        closed: true);

    // The analytic flight path, thin and faint, so the recorded trail can be seen landing exactly on the
    // curve the equations predict: y = y0 + (vy/vx)(x - x0) - g (x - x0)^2 / (2 vx^2)
    chart.Plot(
        x => launchPosition.Y + launchVelocity.Y / launchVelocity.X * (x - launchPosition.X)
            - Gravity * (x - launchPosition.X) * (x - launchPosition.X) / (2f * launchVelocity.X * launchVelocity.X),
        color: new Color(180, 180, 180),
        name: "ballistic",
        style: new ChartSeriesStyle { Width = options.Series.CurveWidth * 0.5f });

    // The live trail the flying ball leaves behind; one point is appended per frame in Update
    trail = chart.AddTrajectory(capacity: 900, name: "throw");

    // Scatter: noisy measurements around the sin curve, drawn as pixel-sized x glyphs each frame - the
    // classic "data points versus fitted curve" picture. The jitter is a deterministic hash of x, so the
    // picture is identical every run without involving Random.
    var samples = new List<Vector3>();

    for (var x = -4.5f; x <= 4.5f; x += 0.45f)
    {
        var hash = MathF.Sin(x * 12.9898f) * 43758.5453f;
        var jitter = (hash - MathF.Floor(hash) - 0.5f) * 0.7f;
        samples.Add(new Vector3(x, 2f * MathF.Sin(x) + jitter, 0f));
    }

    chart.AddMarkers(samples, color: new Color(96, 66, 166), name: "samples");

    // The integral picture: one arch of the sine shaded down to the x axis, re-sampled and re-clipped
    // with the curves whenever the view changes
    chart.AddArea(x => 2f * MathF.Sin(x), from: 0f, to: MathF.PI, color: options.Series.Palette[0], name: "integral");

    // The animated curve. An explicit colour keeps the palette rotation of the other series unchanged.
    wave = chart.Plot(x => WaveAmplitude * MathF.Sin(waveFrequency * x), color: new Color(0, 158, 150), name: "wave");

    // The ball is drawn each frame as a disc in a shape batch the chart shares: one batch draws the
    // chart's strokes and the ball, and submitting the ball after Update puts it over the curves
    batch = game.AddShapeBatch(depthTest: true);

    // A readout that follows the mouse over the chart plane
    chart.Options.Cursor.Visible = true;

    // The view-driven part: the chart re-targets its ranges to whatever the camera sees, so the grid
    // always fills the window and the tick step adapts to the zoom
    chart.Options.Range.FollowCamera = true;

    ThrowBall();

    var overlay = DebugOverlay.GetOrCreate(game);

    // The default box is Stride's 49% black, tuned for dark scenes; on paper white it needs to be darker
    overlay.BackgroundColor = new Color(0, 0, 0, 200);
    overlay.FontSize = 16;
    overlay.LineSpacing = 1;

    overlay.AddSection("Chart", () =>
    [
        new("CHART"),
        new($"Press G to toggle the grid ({(chart.Options.Grid.Visible ? "on" : "off")})", Color.Yellow),
        new($"Press T to {(tangent is null ? "restore" : "remove")} the tan curve", Color.Yellow),
        new($"Press L to toggle the legend ({(chart.Options.Legend.Visible ? "on" : "off")})", Color.Yellow),
        new($"Press Space to throw the ball (trail: {trail.Count}/{trail.Capacity} points)", Color.Yellow),
        new($"Press A to {(animate ? "pause" : "resume")} the wave (k = {waveFrequency:0.00})", Color.Yellow),
        new($"{chart.Series.Count} series: {string.Join(", ", chart.Series.Select(s => s.Name))}"),
    ]);
}

void Update(Scene scene, GameTime time)
{
    if (chart is null) return;

    if (game.Input.IsKeyPressed(Keys.G))
    {
        chart.Options.Grid.Visible = !chart.Options.Grid.Visible;
    }

    if (game.Input.IsKeyPressed(Keys.L))
    {
        chart.Options.Legend.Visible = !chart.Options.Legend.Visible;
    }

    // Remove frees the ribbon's GPU buffers; plotting again builds new ones
    if (game.Input.IsKeyPressed(Keys.T))
    {
        if (tangent is null)
        {
            tangent = chart.Plot(MathF.Tan, name: "tan", samples: 600);
        }
        else
        {
            chart.Remove(tangent);
            tangent = null;
        }
    }

    if (game.Input.IsKeyPressed(Keys.Space))
    {
        ThrowBall();
    }

    if (game.Input.IsKeyPressed(Keys.A))
    {
        animate = !animate;
    }

    // Swapping the function rebuilds one mesh in place - same entity, same colour, same legend row - so
    // it is cheap enough to do every frame
    if (animate && wave is not null)
    {
        waveTime += (float)time.Elapsed.TotalSeconds;
        waveFrequency = 1.75f + 1.25f * MathF.Sin(waveTime * 0.9f);

        wave.SetFunction(x => WaveAmplitude * MathF.Sin(waveFrequency * x));
    }

    // The chart's frame: applies whatever changed in its options since last time (the G and L toggles
    // above, the range the follower derives from the camera) and moves the cursor readout. The camera is
    // explicit because a scene can hold several, and only you know which one is looking at this chart.
    camera ??= scene.Entities.Select(e => e.Get<CameraComponent>()).FirstOrDefault(c => c != null);

    if (camera is not null && batch is not null)
    {
        chart.Update(camera, batch);
        batch.DrawDisc(new Vector3(ballPosition.X, ballPosition.Y, 0.05f), Vector3.UnitZ, 0.12f, new Color(40, 40, 40));
    }

    if (!ballFlying || trail is null) return;

    // Semi-implicit Euler; capped so a stall (a dragged window) cannot teleport the ball
    var dt = MathF.Min((float)time.Elapsed.TotalSeconds, 0.1f);

    ballVelocity.Y -= Gravity * dt;
    ballPosition += ballVelocity * dt;

    // The trajectory clips to the chart's ranges by itself; the trail simply ends at the edge
    trail.Add(new Vector3(ballPosition.X, ballPosition.Y, 0f));

    if (ballPosition.Y < chart.Options.Range.YMin - 1f || ballPosition.X > chart.Options.Range.XMax + 1f)
    {
        ballFlying = false;
    }
}

void ThrowBall()
{
    trail?.Clear();
    ballPosition = launchPosition;
    ballVelocity = launchVelocity;
    ballFlying = true;
}