Charts 3D
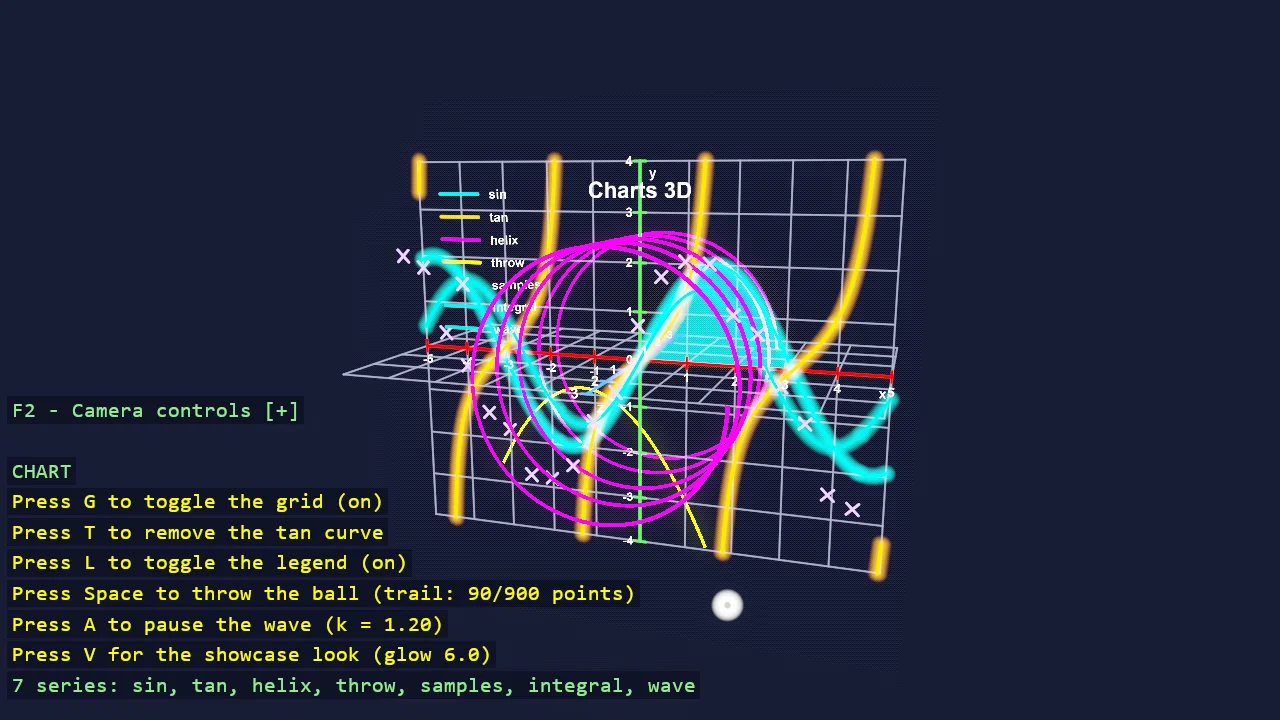
The same code-only chart API as the 2D example, in a lit 3D scene. A chart becomes 3D by giving its Z range a spread: it gains a Z axis, its clipping becomes a box rather than a rectangle, and its grid can cover the XZ floor as well as the XY wall. Curves that stay at z = 0 draw exactly as they do flat, so a helix and a ball thrown through the depth are what actually use the third dimension. An orbit camera inspects the figure from any angle, and FrameCamera backs the camera off until every corner of the chart fits the window - the projection maths that decides how far "far enough" is.
The Program.cs file shows how to:
- Turning a chart 3D by giving its Z range a spread
- Box clipping instead of rectangle clipping
- Grid planes on the XY wall and the XZ floor
- A parametric helix through the depth of the chart
- A trajectory recorded through all three axes
- Orbiting a figure with Basic3DOrbitCameraController
- Framing a bounding box in a perspective camera with FrameCamera
- An additive glow halo on every stroke, wider for the showcase look
Note
This example references Stride.CommunityToolkit.Charts, which is not on NuGet yet. Run it from a clone of the
repository, where the package is a project reference; a copy of the project on its own will not build.
View on GitHub.
using Stride.CommunityToolkit.Charts;
using Stride.CommunityToolkit.Engine;
using Stride.CommunityToolkit.Rendering.Compositing;
using Stride.CommunityToolkit.Rendering.Text;
using Stride.CommunityToolkit.Scripts;
using Stride.CommunityToolkit.Scripts.Utilities;
using Stride.CommunityToolkit.Shapes;
using Stride.CommunityToolkit.Windows;
using Stride.Core.Mathematics;
using Stride.Engine;
using Stride.Rendering.Images;
using Stride.Games;
using Stride.Input;

// The same chart API as E11_2D_Charts, in a lit 3D scene - and what the third axis adds.
//
// A chart becomes 3D by giving its Z range a spread: the axes gain a Z axis, clipping becomes a box
// rather than a rectangle, and the grid can cover the XZ floor as well as the XY wall. Curves that stay
// at z = 0 draw exactly as they do on the flat chart, so everything from the 2D example still works;
// the helix and the thrown ball are the ones that use the depth.
//
// Two more things are 3D-only: an orbit camera to inspect the figure from any angle, and FrameCamera,
// which backs the camera off until every corner of the chart fits the window. What is missing here is
// FollowCamera - re-targeting the ranges to what the camera sees is an orthographic idea.
//
// Controls: left-drag orbits, middle-drag pans, wheel zooms, H resets the view; G grid, L legend,
// T removes or restores tan, Space throws the ball, A pauses the animated curve, V switches between
// the chart look and the showcase look.

// Without this a scaled-up 4K desktop hands the game a scaled, blurred window. A no-op off Windows.
WindowsDpiManager.EnablePerMonitorV2();

using var game = new Game();

Chart? chart = null;
ChartCurve? tangent = null;
ChartCurve? wave = null;
ChartTrajectory? trail = null;
CameraComponent? camera = null;
ShapeBatch? batch = null;

// The thrown ball, integrated by hand each frame. Unlike the 2D example it is given a Z velocity too, so
// the recorded trail arcs through the depth of the chart instead of staying on the front plane.
var launchPosition = new Vector3(-4.5f, -3.5f, -2.5f);
var launchVelocity = new Vector3(4f, 7f, 1.6f);
const float Gravity = 9.81f;
var ballPosition = Vector3.Zero;
var ballVelocity = Vector3.Zero;
var ballFlying = false;

// The animated curve: sin(kx) with k sweeping up and down, re-plotted in place every frame
var animate = true;
var showcase = false;
LightComponent? keyLight = null;
Bloom? bloom = null;
const float ChartGlow = 6f;
const float ShowcaseGlow = 16f;
const float ChartLight = 20f;
const float ShowcaseLight = 2f;
var waveTime = 0f;
var waveFrequency = 1f;
const float WaveAmplitude = 1.5f;

game.Run(start: Start, update: Update);

void Start(Scene rootScene)
{
    game.Window.AllowUserResizing = true;
    game.Window.Title = "Charts 3D";

    // What SetupBase3D does, with a dark background instead of cornflower blue: emissive curves above
    // intensity 1 only look like they glow against something dark
    game.AddGraphicsCompositor(clearColor: new Color(16, 18, 28)).AddCleanUIStage();

    // Bloom is off by default, like every post effect; the glow look needs it on. The showcase widens
    // it later, since the default is tuned for a scene, not for thin bright lines.
    game.ConfigurePostEffects(fx =>
    {
        fx.Bloom.Enabled = true;
        bloom = fx.Bloom;
    });
    game.Add3DCamera();
    game.Add3DCameraController();
    keyLight = game.AddDirectionalLight(intensity: ChartLight).Get<LightComponent>();

    // Glow3D is the lit preset: bright palette, emissive intensity above 1, which the default
    // compositor's bloom turns into a glow
    var options = ChartOptions.Glow3D();

    options.Range.XMin = -5f;
    options.Range.XMax = 5f;
    options.Range.YMin = -4f;
    options.Range.YMax = 4f;

    // This is what makes the chart 3D: a Z extent. Without it the two Z bounds are equal and everything
    // below still works - it is simply flat.
    options.Range.ZMin = -3f;
    options.Range.ZMax = 3f;

    // A wall behind the curves and a floor under them, both bounded to the ranges so they read as part
    // of the figure rather than an endless grid
    options.Grid.Planes = ChartGridPlanes.XY | ChartGridPlanes.XZ;
    options.Grid.Visible = true;

    options.Title.Text = "Charts 3D";
    options.Axes.XTitle = "x";
    options.Axes.YTitle = "y";
    options.Axes.ZTitle = "z";

    chart = new Chart(game, options);

    // Lifted so most of the chart stands above the ground plane of the scene
    chart.Root.Transform.Position = new Vector3(0, 3f, 0);
    chart.Root.Scene = rootScene;

    chart.Plot(x => 2f * MathF.Sin(x), name: "sin");

    // tan(x) is cut into branches at its asymptotes and clipped to the chart box, exactly as in 2D
    tangent = chart.Plot(MathF.Tan, name: "tan", samples: 600);

    // A curve only a 3D chart can hold: x and y trace a circle while z advances
    chart.PlotParametric(
        t => new Vector3(2.5f * MathF.Cos(t), 2.5f * MathF.Sin(t), t / MathUtil.TwoPi - 2f),
        0f, 5f * MathUtil.TwoPi,
        name: "helix",
        samples: 400);

    // The live trail of the thrown ball; in 3D it is clipped to the box, not the rectangle
    trail = chart.AddTrajectory(capacity: 900, name: "throw");

    // Scatter markers, here lifted off the front plane so they sit inside the box
    var samples = new List<Vector3>();

    for (var x = -4.5f; x <= 4.5f; x += 0.45f)
    {
        var hash = MathF.Sin(x * 12.9898f) * 43758.5453f;
        var jitter = (hash - MathF.Floor(hash) - 0.5f) * 0.7f;
        samples.Add(new Vector3(x, 2f * MathF.Sin(x) + jitter, 1.5f));
    }

    chart.AddMarkers(samples, color: new Color(186, 132, 255), name: "samples");

    // A shaded region still belongs to the XY plane - the picture of a definite integral
    chart.AddArea(x => 2f * MathF.Sin(x), from: 0f, to: MathF.PI, color: options.Series.Palette[0], name: "integral");

    wave = chart.Plot(x => WaveAmplitude * MathF.Sin(waveFrequency * x), color: new Color(0, 210, 200), name: "wave");

    // The ball is drawn each frame as a glowing disc in a shape batch the chart shares: one batch draws
    // the chart's strokes and the ball, and submitting the ball after Update puts it over the curves
    batch = game.AddShapeBatch(depthTest: true);

    chart.Options.Cursor.Visible = true;

    ThrowBall();

    // Swap the fly controller for an orbit around the chart, then frame the camera so the whole figure
    // fits the window. The orbit reads its starting angles from the pose FrameCamera leaves behind.
    var cameraEntity = rootScene.Entities.FirstOrDefault(e => e.Get<CameraComponent>() != null);

    if (cameraEntity?.Get<CameraComponent>() is { } sceneCamera)
    {
        if (cameraEntity.Get<Basic3DCameraController>() is { } flyController)
        {
            cameraEntity.Remove(flyController);
        }

        cameraEntity.Add(new Basic3DOrbitCameraController { Target = chart.Root.Transform.Position });

        // A gently angled start, mostly facing the chart plane: the framing distance is set by the box
        // corner the frustum touches, and the helix gives the box real depth, so a flatter angle fills
        // more of the window
        cameraEntity.Transform.Rotation = Quaternion.RotationYawPitchRoll(
            MathUtil.DegreesToRadians(18f), MathUtil.DegreesToRadians(-12f), 0f);

        chart.FrameCamera(sceneCamera, padding: 0.12f);
    }

    var overlay = DebugOverlay.GetOrCreate(game);

    // The chart fills the window, so the help goes in a corner rather than across the figure (F3 moves it)
    overlay.Position = DisplayPosition.BottomLeft;

    overlay.AddSection("Chart", () =>
    [
        new("CHART"),
        new($"Press G to toggle the grid ({(chart.Options.Grid.Visible ? "on" : "off")})", Color.Yellow),
        new($"Press T to {(tangent is null ? "restore" : "remove")} the tan curve", Color.Yellow),
        new($"Press L to toggle the legend ({(chart.Options.Legend.Visible ? "on" : "off")})", Color.Yellow),
        new($"Press Space to throw the ball (trail: {trail.Count}/{trail.Capacity} points)", Color.Yellow),
        new($"Press A to {(animate ? "pause" : "resume")} the wave (k = {waveFrequency:0.00})", Color.Yellow),
        new($"Press V for the {(showcase ? "chart" : "showcase")} look (glow {chart.Options.Series.Glow:0.0})", Color.Yellow),
        new($"{chart.Series.Count} series: {string.Join(", ", chart.Series.Select(s => s.Name))}"),
    ]);
}

void Update(Scene scene, GameTime time)
{
    if (chart is null) return;

    if (game.Input.IsKeyPressed(Keys.G))
    {
        chart.Options.Grid.Visible = !chart.Options.Grid.Visible;
    }

    if (game.Input.IsKeyPressed(Keys.L))
    {
        chart.Options.Legend.Visible = !chart.Options.Legend.Visible;
    }

    if (game.Input.IsKeyPressed(Keys.T))
    {
        if (tangent is null)
        {
            tangent = chart.Plot(MathF.Tan, name: "tan", samples: 600);
        }
        else
        {
            chart.Remove(tangent);
            tangent = null;
        }
    }

    if (game.Input.IsKeyPressed(Keys.Space))
    {
        ThrowBall();
    }

    if (game.Input.IsKeyPressed(Keys.A))
    {
        animate = !animate;
    }

    // The showcase look. What holds the figure back in the default view is the grid behind the curves and
    // a modest glow halo. Drop the grid and widen the halo and the same figure reads as the neon thing you
    // get by orbiting behind it - no rotating needed. Glow is a number the strokes read as they are
    // submitted, so nothing is rebuilt.
    if (game.Input.IsKeyPressed(Keys.V))
    {
        showcase = !showcase;

        chart.Options.Grid.Visible = !showcase;
        chart.Options.Series.Glow = showcase ? ShowcaseGlow : ChartGlow;

        // The light matters more than it looks. A ribbon is emissive AND lit, so a bright key light adds
        // white to every curve and washes the colour out - which is why the halo always looked better from
        // behind, where the ribbons face away from it. Dimming the light is what brings that side to the
        // front; it is not turned off, so the labels and axes keep some shading.
        if (keyLight is not null)
        {
            keyLight.Intensity = showcase ? ShowcaseLight : ChartLight;
        }

        // The last piece, and the one that explains why orbiting behind the chart always looked better:
        // bloom spreads in SCREEN space, so the same halo covers far more of a figure that sits small in
        // the frame than of one that fills it. Rather than push the camera away, widen the bloom.
        if (bloom is not null)
        {
            bloom.Radius = showcase ? 20f : 10f;
            bloom.Amount = showcase ? 0.5f : 0.3f;
        }
    }

    if (animate && wave is not null)
    {
        waveTime += (float)time.Elapsed.TotalSeconds;
        waveFrequency = 1.75f + 1.25f * MathF.Sin(waveTime * 0.9f);

        wave.SetFunction(x => WaveAmplitude * MathF.Sin(waveFrequency * x));
    }

    // The chart's frame: applies whatever changed in its options (the toggles above, the showcase glow)
    // and moves the cursor readout. Nothing follows the camera here - that is the 2D chart's trick - but
    // the call is the same, and the camera is explicit because a scene can hold several.
    camera ??= scene.Entities.Select(e => e.Get<CameraComponent>()).FirstOrDefault(c => c != null);

    if (camera is not null && batch is not null)
    {
        chart.Update(camera, batch);

        batch.Glow.Set(chart.Options.Series.Glow);
        batch.Glow.Additive = true;
        batch.DrawBillboardCircle(chart.Root.Transform.Position + ballPosition, 0.12f, Color.White);
        batch.Glow.Clear();
    }

    if (!ballFlying || trail is null) return;

    var dt = MathF.Min((float)time.Elapsed.TotalSeconds, 0.1f);

    ballVelocity.Y -= Gravity * dt;
    ballPosition += ballVelocity * dt;

    trail.Add(ballPosition);

    if (ballPosition.Y < chart.Options.Range.YMin - 1f || ballPosition.X > chart.Options.Range.XMax + 1f)
    {
        ballFlying = false;
    }
}

void ThrowBall()
{
    trail?.Clear();
    ballPosition = launchPosition;
    ballVelocity = launchVelocity;
    ballFlying = true;
}